


The impact of concurrent requests on LLM inference performance: a case study with Llama-3.1-8B

This study investigates the performance characteristics of Large Language Model (LLM) inference under varying levels of concurrent requests. Using Llama-3.1-8B-Instruct on an H100 GPU, we analyse the relationship between request concurrency and key performance metrics. Our results reveal distinct optimal operating ranges: interactive scenarios maintain sub-500ms latency up to 21 concurrent requests, while batch processing achieves maximum throughput of 1,724 tokens/second at 45 concurrent requests, representing a 15.5 times improvement over single-request performance. This research provides practical insights for deploying LLM services at scale.
Large Language Models have become an integral part of modern AI applications, so their performance under different load conditions is critical for practical deployments. While single-request performance is well documented, the behaviour of these models under concurrent load presents unique challenges and trade-offs that warrant detailed investigation.
Methodology
Experimental setup
Hardware configuration
NVIDIA H100 SXM5 80GB GPU
CUDA version: 12.4
Driver version: 550.54.15
Intel(R) Xeon(R) Platinum 8462Y+ (30 cores)
120GB System RAM
Software Stack
Model: Llama-3.1-8B-Instruct
Inference framework: sglang
Model configuration: FP16 precision, context length 32000
KV-cache enabled
Network characteristics
Baseline network latency: 51ms
Stream mode enabled for response generation
Test configuration
Test parameters
Concurrent requests: 1 to 81
Fixed system prompt: 3000 tokens
Variable user input: 100-500 tokens
Test sequence repeated 100 times per concurrency level
Metrics measured
First Token Latency (FTL)
Total response time
Tokens per second
Resource Utilisation
Results and analysis
First Token Latency analysis
Our measurements reveal distinct phases in First Token Latency (FTL) behaviour as concurrency increases:
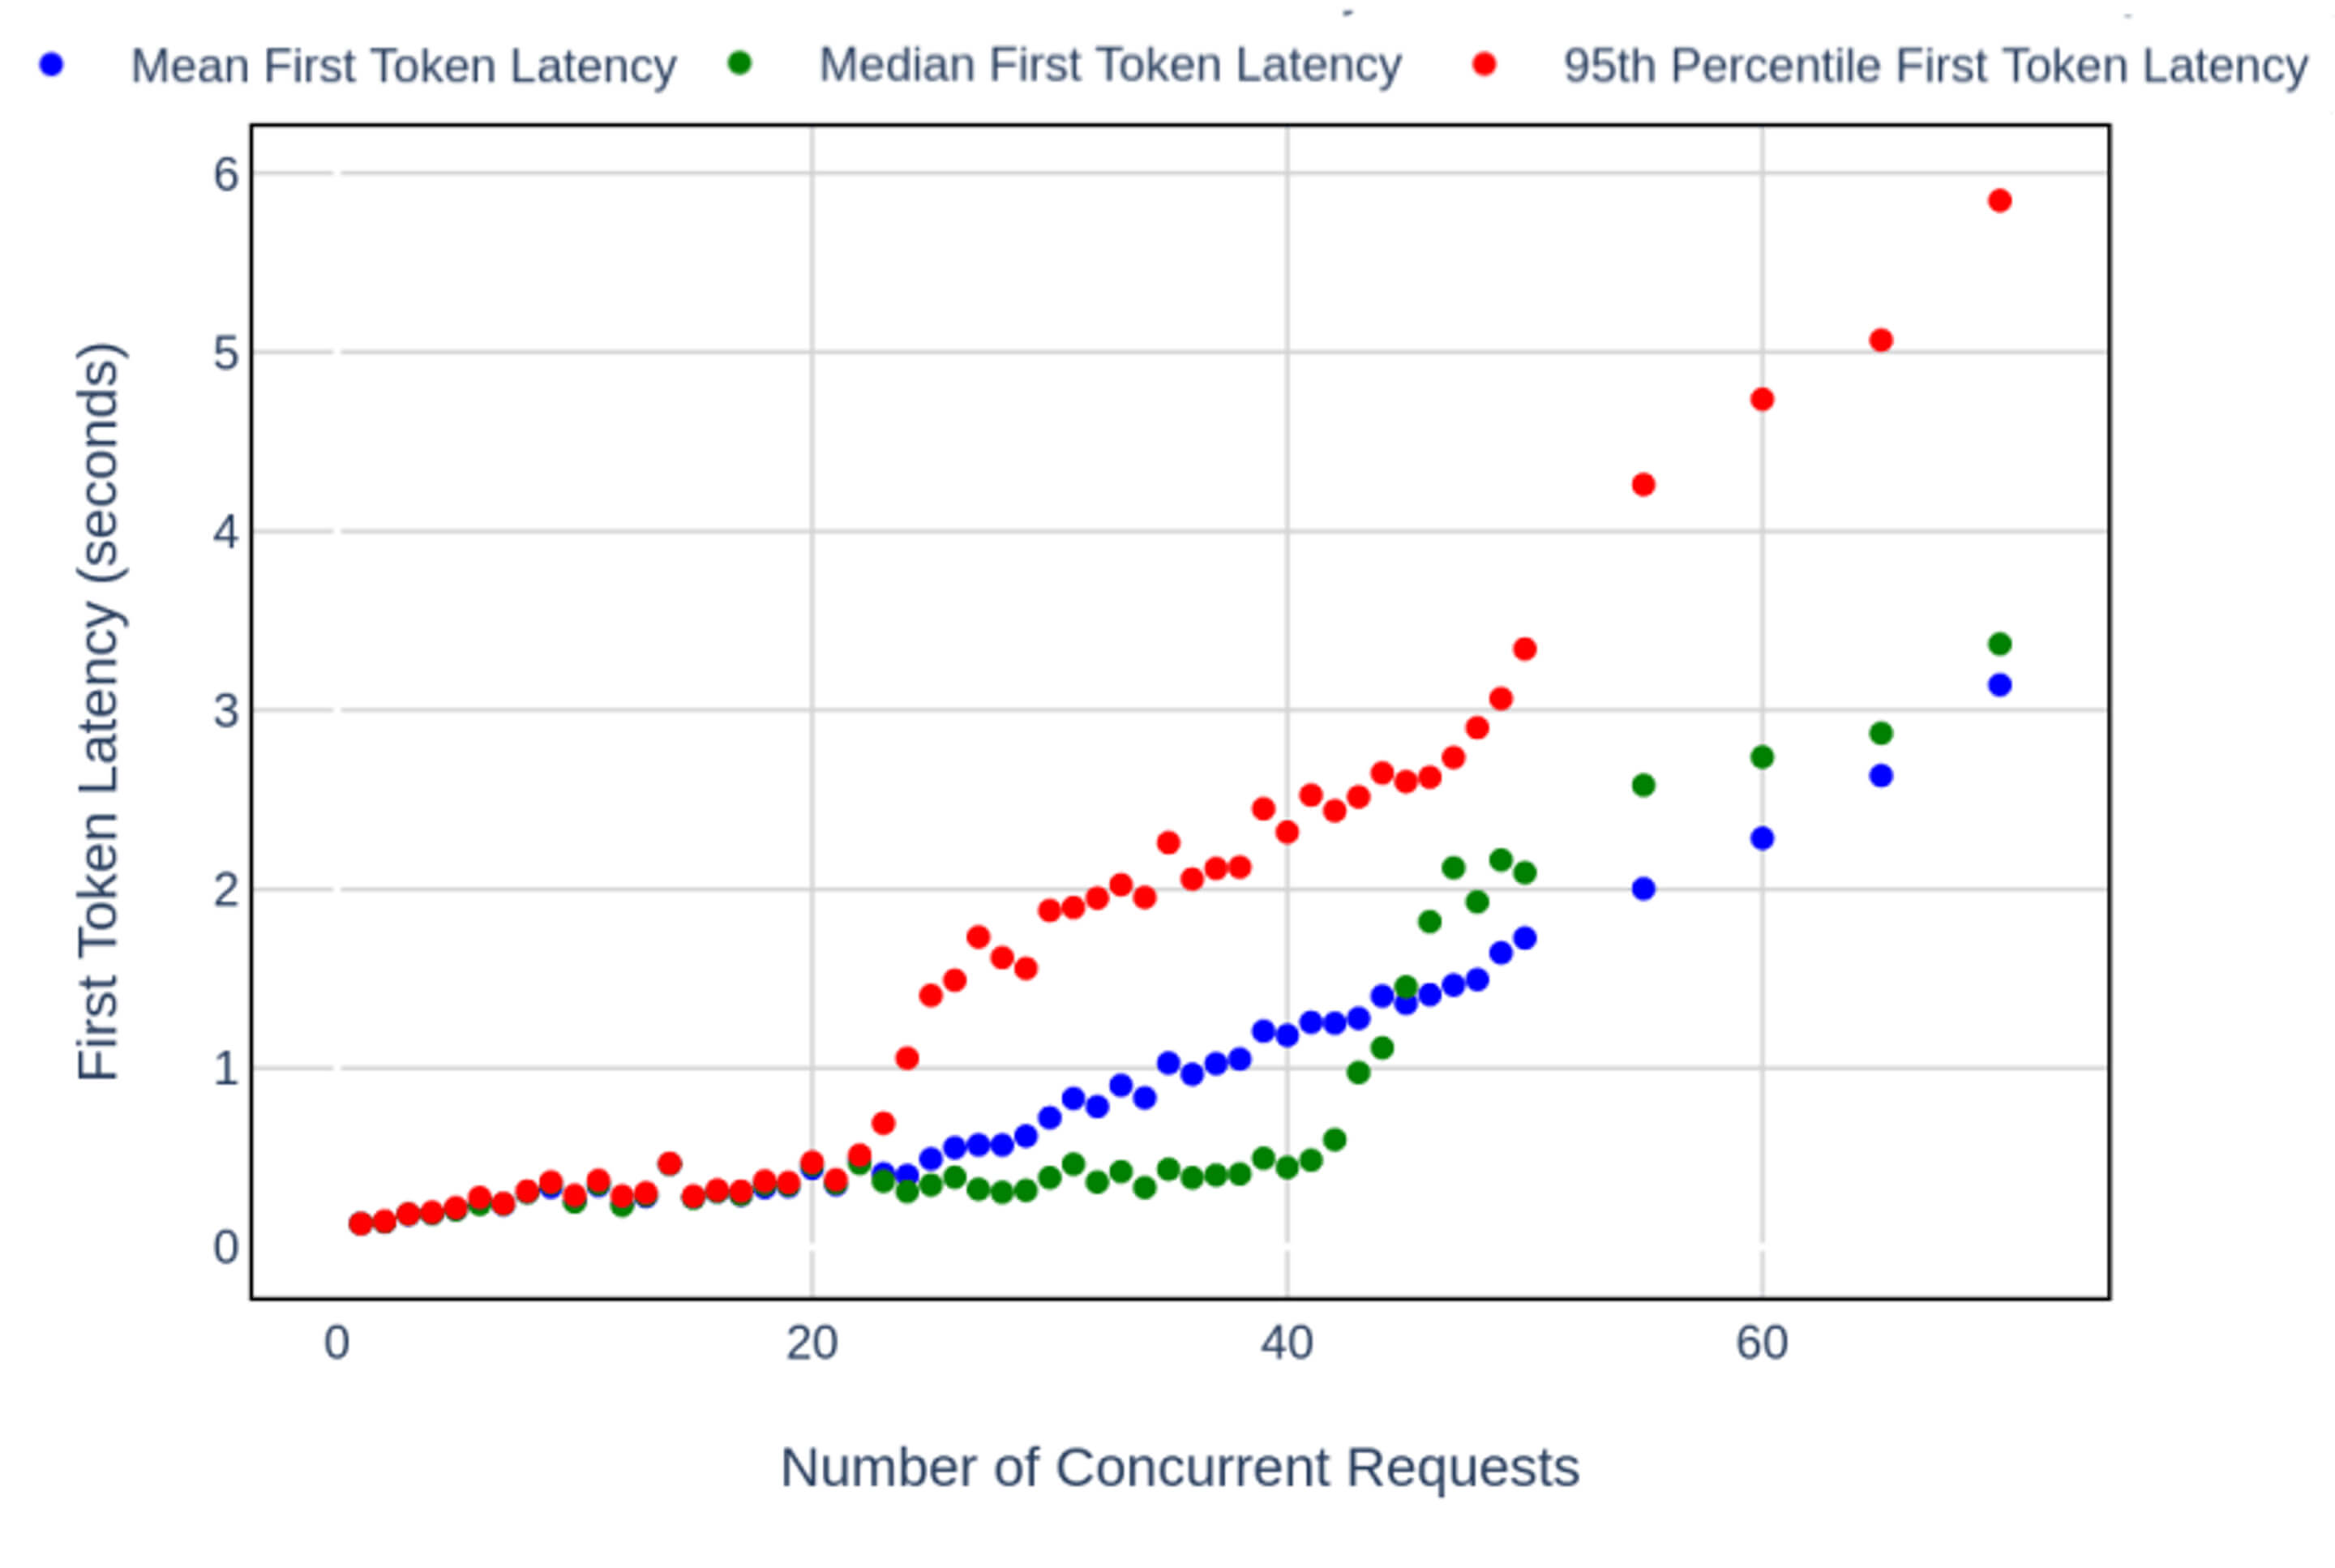
Low concurrency phase (1-10 requests)
Base FTL (single request): 113ms median (62ms excluding network latency)
Highly efficient initial performance for single requests
Graceful latency increase up to 10 concurrent requests, with median FTL reaching around 260ms, representing only a 2.3x increase (3.3x excluding network latency) despite 10x more concurrent requests
System shows excellent responsiveness in this range
Stable phase (11-21 requests)
Median FTL consistently remains between 220-340ms
P95 latencies remain below 500ms
Minimal variance between minimum and maximum latencies
Ideal range for interactive applications that require consistent response times
Transition phase (22-35 requests)
Sharp increase in latency variability
Median FTL rises to 400-600ms
P95 latencies start to exceed 1 second
First signs of system stress appear
High concurrency phase (36+ requests)
Exponential increase in both median and tail latency
At 70 concurrent requests:
Median FTL: 3.37 seconds
P95 FTL: 5.85 seconds
High variance between min and max latencies
Clear pattern of performance degradation
Throughput analysis
Our throughput analysis reveals complex relationships between concurrency and token generation speed:
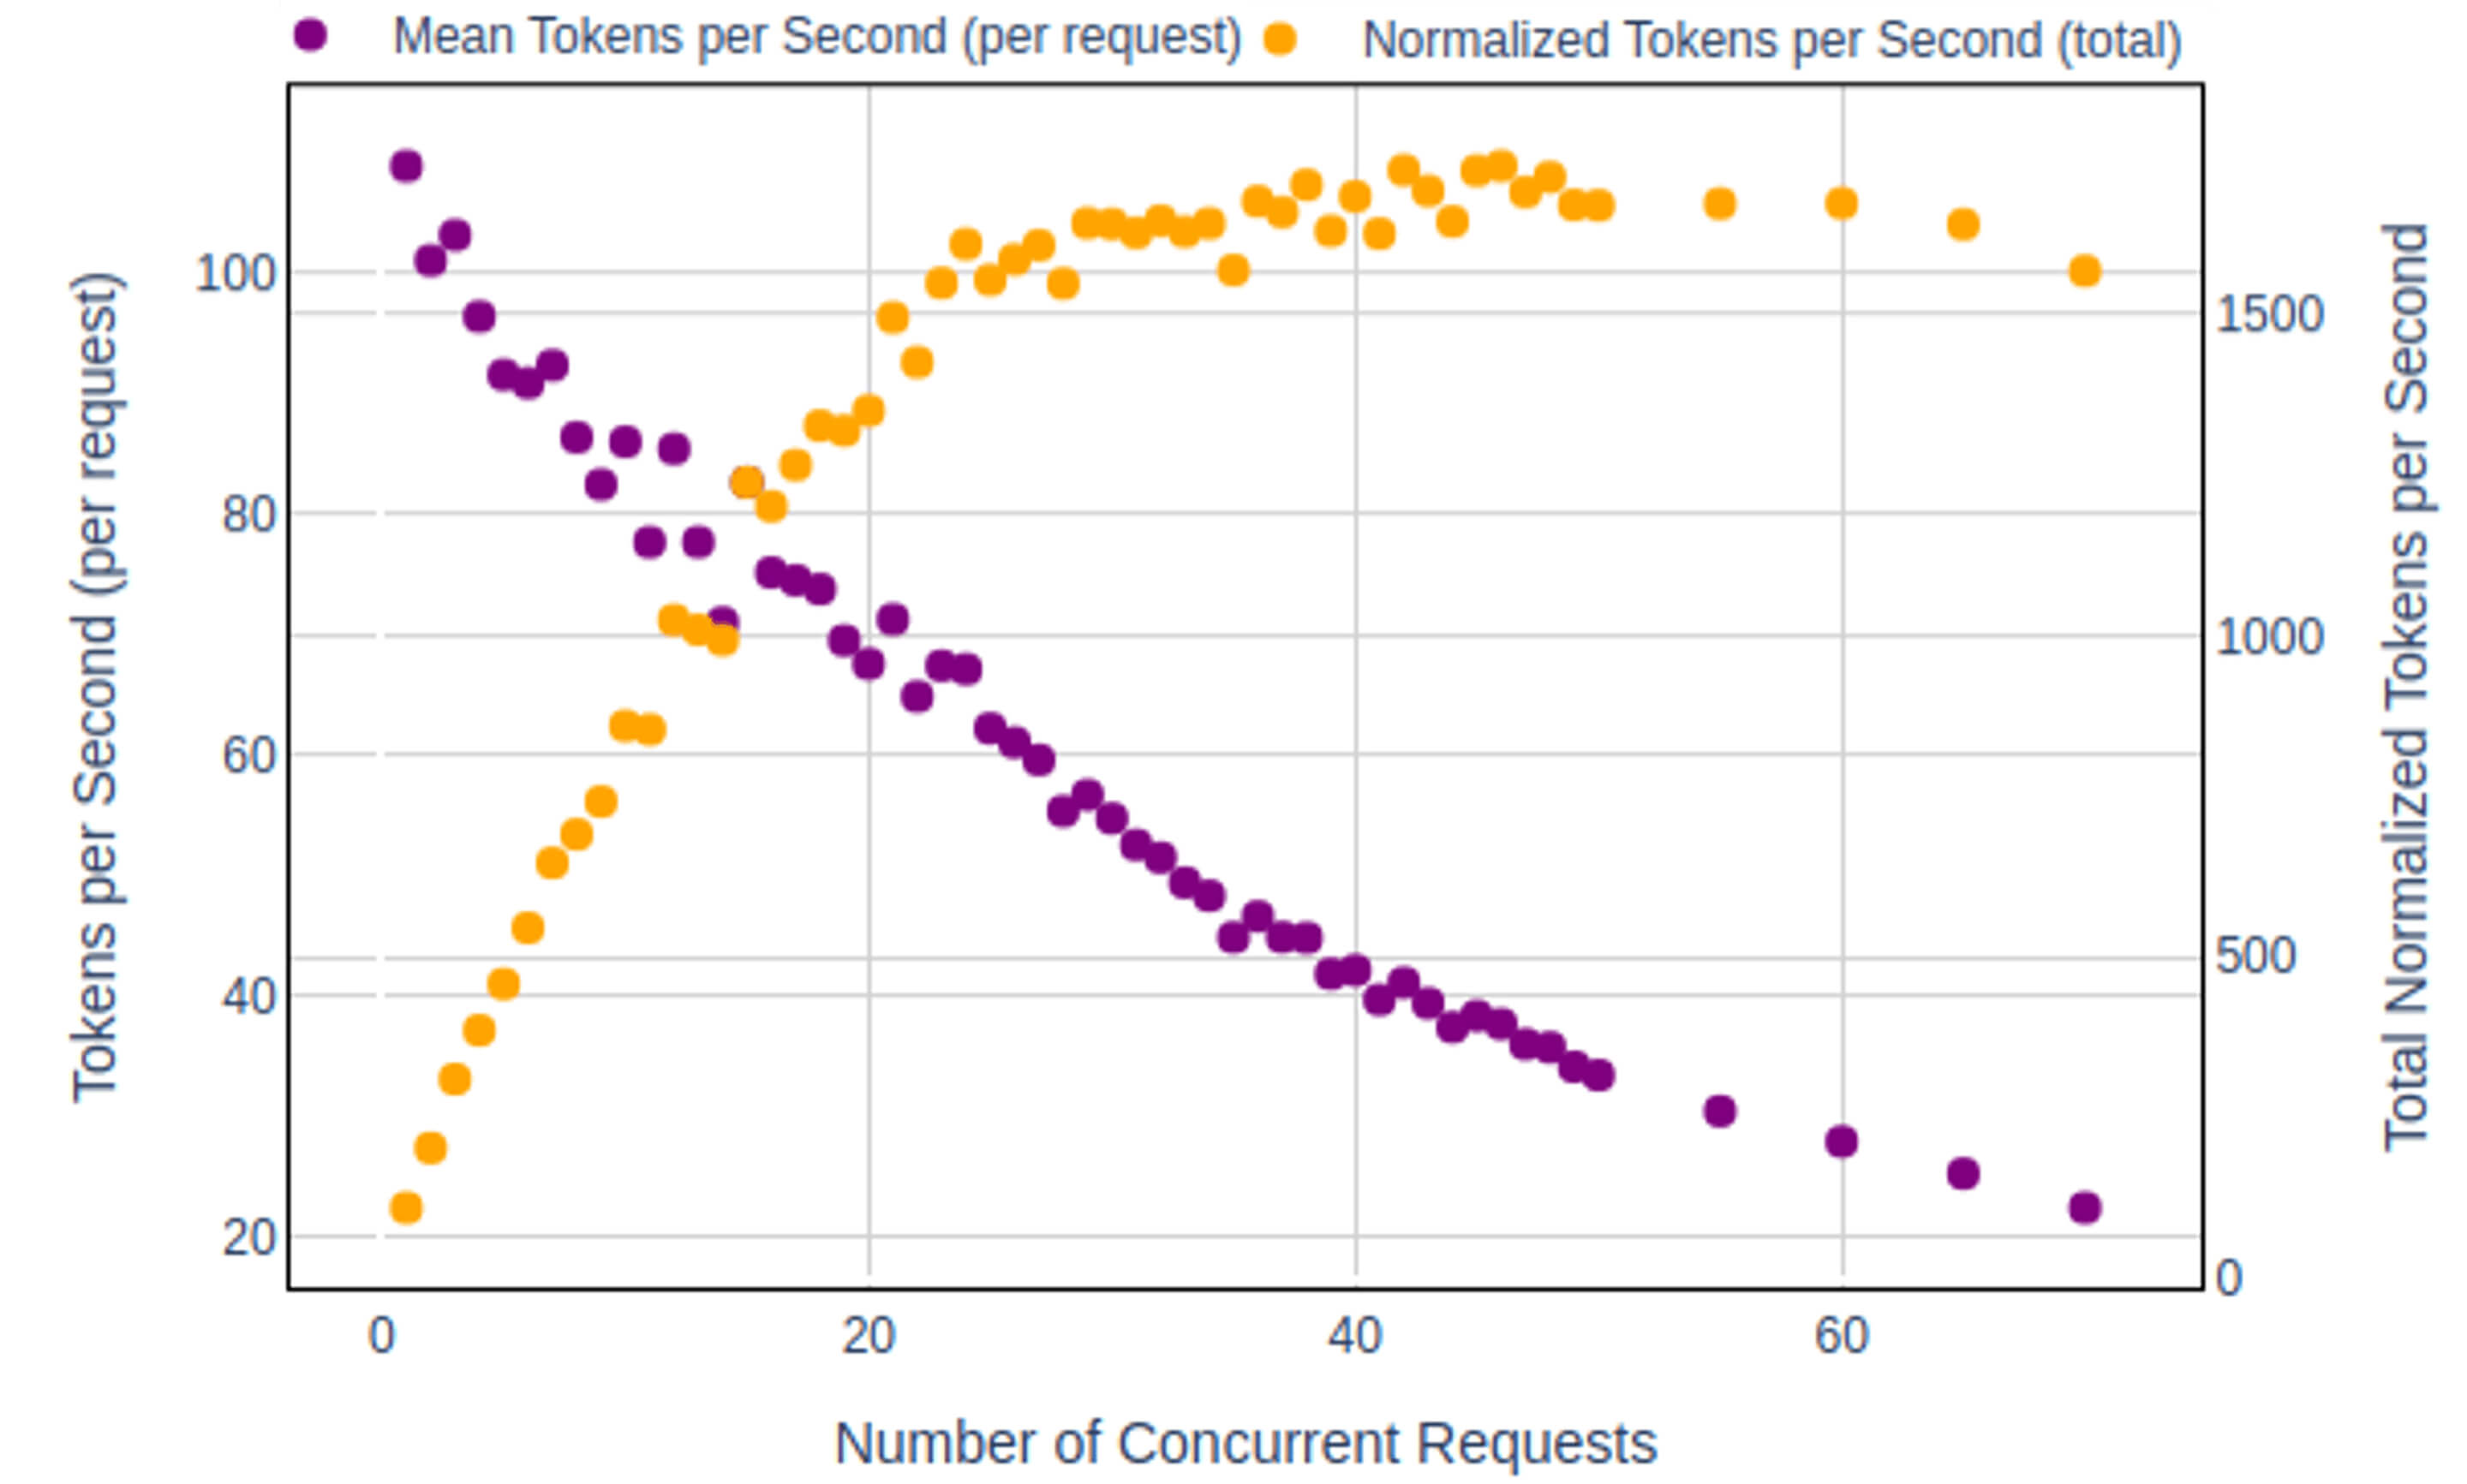
Performance per request
Single-request baseline: 111.29 tokens/second
Gradually declining as concurrency increases:
20 requests: ~67 tokens/second per request
40 requests: ~42 tokens/second per request
70 requests: ~22 tokens/second per request
System-wide throughput
The overall system throughput shows different characteristics:
Linear growth up to ~15 requests
Sub-linear increase from 15-45 requests
Maximum throughput of 1,724 tokens/second achieved at 45 concurrent requests
Plateau and slight decline beyond 45 requests
Efficiency sweet spot identified between 35-45 concurrent requests
Peak total system throughput approximately 15.5 times the throughput of a single request
Resource usage and system behaviour
Memory usage patterns
Consistently high GPU memory utilisation (98.1%)
KV cache hit rate: 26.29%
Memory efficiency remains stable across concurrency levels
Response time distribution
Overall response time increases more slowly than FTL
At optimal concurrency (≤21 requests):
Mean response time: 1.1-1.5 seconds
P95 response time: 1.2-1.7 seconds
At high concurrency (70+ requests):
Median response time: 5.8-7.1 seconds
P95 response time: 7.1-8.7 seconds
System stability
No failed requests observed throughout testing
Consistent chunk interval times across concurrency levels
Test results show that the system remained stable under heavy load, albeit with degraded performance
Performance trade-offs
Our analysis shows clear trade-offs between different performance metrics:
1. Latency vs. concurrency
Inverse relationship between response speed and number of concurrent requests
Non-linear degradation pattern
Critical points identified at 22 and 45 concurrent requests
2. Throughput vs. latency
While performance per request decreases with concurrency, overall system throughput increases up to 45 requests
System achieves maximum throughput of 1,724 tokens/second at 45 concurrent requests
Sweet spot highly dependent on use case requirements
Clear distinction between interactive and batch processing sweet spots
3. Resource utilization vs. performance
High GPU memory utilisation at all concurrency levels
KV cache hit rate suggests room for memory management optimisation
System remains stable at high concurrency levels, indicating robust resource management
Discussion
Our experimental results reveal complex performance characteristics of LLM inference under varying concurrent loads, with significant implications for both system design and deployment strategies. The observed 15.5-fold throughput improvement from single-request to optimal batch performance suggests significant opportunities for system optimisation, but also highlights the inherent trade-offs in LLM serving systems.
Performance characteristics and implications for system design
The performance patterns we observed suggest that LLM serving systems operate in different efficiency regimes. The initial sharp improvement in system throughput up to 15 concurrent requests, followed by sub-linear growth up to 45 requests, suggests a complex interaction between the GPU's parallel processing capabilities and the memory subsystem. This behaviour is likely due to the GPU's ability to hide latency through parallel execution up to a certain point, after which memory bandwidth and cache efficiency become limiting factors.
The relatively low KV cache hit rate of 26.29% is particularly interesting, as it suggests significant room for optimisation in memory usage patterns. This could be addressed through various mechanisms, such as improved prompt templating or request similarity analysis. However, the high GPU memory utilisation (98.1%) indicates that we're operating close to the limits of the hardware, suggesting that any improvements would have to come from better memory management rather than additional resource allocation.
Architectural implications
These results suggest that single-queue architectures may be suboptimal for LLM serving systems. Instead, our results suggest that a multi-tier architecture, with separate serving strategies for different types of workloads, could better serve different use cases. Interactive applications requiring low latency could be served by a low concurrency tier, while batch processing jobs could be routed to a high concurrency tier optimised for throughput.
The sharp performance degradation beyond certain concurrency thresholds suggests the importance of implementing sophisticated queue management systems. Rather than allowing unlimited concurrent requests, systems should implement adaptive admission control based on current load and performance metrics. This could help maintain optimal performance by keeping the system operating in its most efficient range.
Future optimisation opportunities
Several promising directions for optimisation emerge from our analysis. The relatively low cache hit rate suggests that investigating prompt standardisation and cache warming strategies could yield significant improvements. In addition, the distinct performance regimes we observed suggest that dynamic scaling and load balancing strategies could be highly effective if properly tuned to these characteristics.
The relationship between throughput and latency that we observed also suggests that custom scheduling algorithms designed specifically for LLM workloads could significantly improve system performance. These schedulers could take into account factors such as prompt length, expected response length and cache affinity to make more intelligent scheduling decisions.
Limitations and future work
While our study provides valuable insights, it also has several limitations that warrant further investigation. Our tests used a specific model size and hardware configuration; understanding how these patterns scale across different model sizes and hardware platforms would be valuable. In addition, while our synthetic workload was designed to be representative, it may not capture all the complexities of real-world usage patterns.
Future work should investigate how these performance characteristics change with different model architectures, different prompt lengths, and more diverse workload patterns. In addition, exploring the impact of different optimisation techniques, such as continuous batching or dynamic tensor parallelism, could provide valuable insights for system optimisation.
The performance patterns we observe also raise interesting questions about the fundamental limits of LLM serving systems, and how close current architectures are to these theoretical limits. Understanding these limits could help guide future hardware and software co-design efforts in this area.
Conclusions and recommendations
Key findings and recommendations
Performance measurement and monitoring
Each deployment should perform specific performance measurements under expected load patterns
Regular monitoring of key metrics (FTL, throughput, resource utilisation) is essential to maintain optimal performance
Consider implementing real-time performance monitoring to detect degradation
Use case-based optimisation
1. Latency critical applications:
Determine maximum concurrency based on worst-case latency requirements
Monitor tail latencies (p95, p99) to ensure consistent user experience
Consider using median latency targets for less stringent applications
2. Batch processing scenarios:
Optimise for maximum system throughput rather than individual request latency
Perform throughput measurements to find optimal concurrency levels
Balance resource utilisation with processing efficiency
Dynamic scaling strategies
Implement dynamic concurrency control based on real-time performance metrics
Consider using adaptive scaling based on:
Current load patterns
Latency requirements
Resource utilisation
Time of day patterns
Set up alerts for performance anomalies
Additional considerations
Although not directly derived from our measurements, the following practices can help organisations better manage their LLM deployments:
Regularly reassess performance characteristics as workload patterns evolve
A/B testing different concurrency strategies
Document performance characteristics for different types of requests
Capacity planning based on both average and peak load scenarios
Future research should examine these patterns across different model sizes, hardware configurations and workload characteristics to develop more generalised optimisation strategies.